 Big data has been around since quite some time but use was restricted due to the extraordinary requirement of resources. Today, tools have matured enough to let even medium scale enterprises take advantage with minimal IT infrastructure. The question that arises is how do managers who have a passing knowledge about analytics make sense of data before them? An excel sheet may contain all the data but image a vast spreadsheet on a screen or even on a large sheet of paper and your eye skipping across cells containing numbers. It is tough. Even excel charts or graphs are limited by way of delivering a visual representation that gives information at a glance. This is where Tableau makes all the difference. Big data application development and usage make more sense when Tableau is in the chain to visualize data.
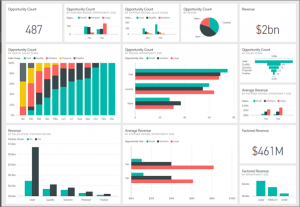
Tableau Data Visualization
VizQL powers Tableau. It has a visual syntax and that makes it easy for users to drag and drop and then customize visual features like color, art, graphics, fonts and shapes. It is data visual storytelling in visuals, a language the mind instinctively understands and grasps. This feature relieves managers or executives from having to learn complex data analysis and presentation tools. All they need to know is how to use Tableau’s visual tools and create line graphs or pictorial representations showing comparisons or growth factors. All this is right there on the screen or on a print. The eye skips from one portion to another and the brain assimilates the information. One can take a look at the broader picture or focus on a narrow segment. The picture informs. The brain does not have to consider numbers and make sense of them. It is instantaneous. This visual data representation assumes even more significance when one is making such a presentation to third parties such as investors who may not have the patience or skills to understand numbers. Tableau connects to SQL, Oracle, Excel and other sources from which it can pull data and create the visualization. In fact, Tableau can integrate with 250 applications compared to 60 in Excel. There is more to it than just this. The Tableau server can draw data from Tableau desktop to permit collaboration and access by users on desktops or mobile. Further data can be secured without scripting, with the administrator assigning rights to users. If you do hire big data development company then do make sure to get Tableau if you want visual analytics with least hassles.
Unifying Data From Different Sources
One of the challenges of big data analytics solutions is to handle data from different sources. Data streams in a structured form, in a semi-structured form and in raw form. This bulk data contains a lot of information but it becomes necessary to streamline or “wash” data and make it presentable for analytics, another area with its specific challenges. What one needs is an agile data handling framework that works in real-time to help derive real-time reports and analytics if the intelligence is to be of use. Tableau simplifies challenges of big data to some extent and it depends on the expertise of big data application development companies how they implement data access and connectivity. Tableau excels in that it establishes SQL to interface with Hadoop, Spark and NoSQL databases. Tableau also incorporates Web Data Connector SDK that helps to connect to data outside of existing connectors over HTTP. Tableau leverages ODBC to work as a translation layer between SQL like data interfaces and SQL such as HiveQL, BigSQL and Spark SQL.
Speed And Flexibility
Where big data is concerned machines can slow down and crawl but Tableau enables fast interaction due to its technologies. Hyper data engine is its in-memory data engine technology. Data can be analyzed speedily regardless of size. It can extract data from slower sources and accelerate the process. Tableau can connect to live data source or import data into memory with the facility to switch between either of the two and that gives flexibility. Overlaying all this is Tableau’s VizQL engine that skips straight of visual representation of data. Interaction with live data in real-time is one of the greatest impact Tableau brings to the table. Coupled with the ability to ingest and prep data through data lakes the process becomes easier than ever. Read this with Tableau’s ability to connect with major Hadoop distributions and with data warehouses like Amazon Web Services Simple storage service and NoSQL databases like MongoDB and Datastax and one can see just how versatile Tableau big data visualization becomes for users. Whether it is Azure, Google Cloud or AWS, Tableau connects, draws data and delivers stunningly impressive visualization of data in a way that is easy to interpret.
Tableau’s Impacts In Various Segments
Just how easy it is to use Tableau and how much of an impact it has can be understood from a few cases:
- Netflix streams video to millions of users and uses Tableau data server connected with AWS. Country managers can view individual dashboards to know viewer patterns and tailor programs accordingly. Only one data source is used as the feed. The result is Netflix is able to dynamically adjust its programming content.
- Edmunds is another case in point that relies on AWS and Tableau to refine its advice to automobile buyers and help them connect with dealers. Tableau’s visual dashboards give the complete picture and support self-service analytics goals. Even those on the staff with no programming skills can use tableau with ease.
- An NGO in Uganda used Tableau’s superb visualization to create pictorials of figures and facts to convince donors and achieved success. Tableau is primarily used by business but the Tableau Foundation also supports non-profit organizations as a way to help solve pressing problems in underdeveloped countries.
There are countless big data analytics solutions but there are drawbacks too and not all of them relate to the solution. It is that big data and understanding derived intelligence in the form of figures is a challenge for people who are not so IT savvy. Tableau simplifies all this by creating visualizations that the mind can view at a glance and get information from which they can draw conclusions, and it happens in just moments. No need to pore over figures as one would have to do in a spreadsheet. If you are into big data, as you should be, to stay on top, then Tableau should be your front end. Get it integrated with the help of big data development company like Smart Sight Innovations.